Implementing multi-tiered system of supports (MTSS) can improve student outcomes (Anderson et al., 2025; Harlacher et al., 2024; Nitz et al., 2023) This includes increasing students’ academic achievement, having better behavioral outcomes, and enhancing student engagement and belonging. But to have a successful MTSS framework, educators must implement practices with fidelity.
What is fidelity? Fidelity is an indicator of how consistently practices are implemented as intended. When a practice does not produce the desired student response, we may feel pressure to identify and try new interventions or assessment tools. Before switching gears, educators should first examine fidelity data and ask, "Are we actually using what we already have as intended?” Often, the solution isn’t doing something new—it’s attending to the fidelity of your current practices.
Below we share three steps for collecting, organizing, and using fidelity data to drive decisions about interventions: Find, Format, Figure Out.
Find the Right Tool
Finding the right tools ensures fidelity is measured accurately and efficiently. The tools selected should provide data on adherence (e.g., the extent to which a teacher follows an intervention protocol) and student engagement (e.g., how well the student was engaged with the practice). In Table 1, we outline a continuum of fidelity measurement tools you may consider using. Review the Fidelity Tip Sheet for additional tips and considerations when measuring fidelity.
Table 1. Example Fidelity Measurement Tools
| Tool | Description | Considerations |
|---|---|---|
| Attendance Log | Documentation of student attendance during sessions. | Easy to gather, but limited information. |
| Work Products | Evaluation of student work products or completion logs. | Efficient to obtain, but analysis can be difficult. |
| Self-Report Checklists | Self-report information gathered via a checklist, such as student self-reports of engagement or teacher self-report of implementation. | Easy to gather data, but subject to misreporting. |
| Observation | Observations of student engagement (e.g., on-task behavior) or of teacher behavior (i.e., implementation of practice elements). | Most direct measure, but time-consuming. |
Format the Data
Once you find the right tool, formatting your data is a key part of staying organized. After gathering fidelity data, organize the data to then make decisions. Educators can organize and report fidelity for each practice used within MTSS. Some examples include the implementation of Tier 1 classroom management strategies, student attendance for a Tier 2 literacy intervention, or adherence to math screening assessment protocol. Formatting data across a variety of sources is a good way to stay organized and allows you to better "figure out" where the issue lies. Once data are collected, graphing is a critical next step in the formatting process. Graphing fidelity data allows teams to visually analyze trends quickly and to track data over time across grade levels, by teacher, and/or by content area.
For example, in the graph shown in Figure 1, a student-level team organized fidelity data to examine teacher adherence to a Tier 3 math intervention. They reviewed the graph and asked, “Are our staff implementing the intervention as intended?” Take a moment and review these data: do you notice any strengths or areas of concern? We’ll dive into the takeaways from the below graph in the next section.
Figure 1. Fidelity Data for Adherence to a Tier 3 Math Intervention
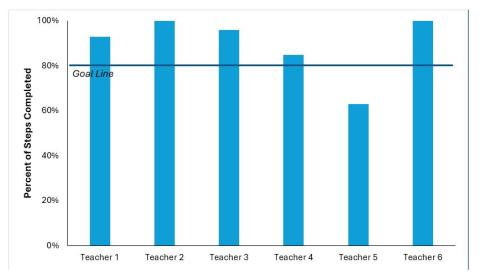
Figure Out What the Data Mean
Once you format the data into an organized system, you can begin to figure out what it is telling you. We encourage you to aim for fidelity of any practice (attendance, engagement, etc.) to be 80% or higher. This is because we want to ensure the majority of elements of a practice are in place consistently. If fidelity meets this minimum threshold, continue with the practice as currently implemented. If fidelity for a practice is below 80%, then some adjustments are needed to improve fidelity.
In the graph above, you notice that the majority of teachers are implementing the practice with fidelity. However, Teacher 5 does not meet the threshold for adherence. That tells us this teacher could use some support - and that should be your first step in addressing the fidelity data.
When determining how to support teachers with fidelity that is below 80%, it is important to reflect on any contextual factors impacting implementation. For example, you can ask yourself if the teacher has sufficient training or resources to successfully implement the practice. Review Table 2 below which outlines reflection questions and next steps to determine which levers to adjust to improve fidelity.
Table 2. Reflection Questions Factors Impacting Fidelity
| Reflection Question | Next Step |
|---|---|
| Is the practice feasible to use? | If no, adjust the practice or adjust logistics so it’s easier to implement. |
| Have staff received enough training or coaching to use the practice? | If no, provide staff with additional training or engage the staff in coaching. |
| Do staff have sufficient resources or support to use the practice as intended? | If no, prioritize the allocation of additional resources or support mechanisms for staff. |
| Is the fidelity tool easy for staff to use? | If no, simplify the tool or reduce the frequency of data collection. |
| Is low fidelity related to student engagement? | If yes, then add engagement or motivation strategies to practice. |
When implemented with fidelity, MTSS can benefit all students. Examining fidelity data closely can help you know when and how to make changes to the practices you implement within MTSS. By examining fidelity data, educators can make more accurate decisions and avoid throwing out good practices that just weren’t implemented as intended.
Check out these additional resources related to fidelity:
- Infrastructure Tip Sheets
- Fidelity Tip Sheet
- Five Elements of Fidelity
- Data Within MTSS
- Student Fidelity Log
References
Anderson, K. P., Bailey, T., Hicks, E., Hirt, S., & Guin, S. (2025). Beating the odds: Learning from grade K-8 schools outperforming expectations for students with disabilities. Crystal City, VA: PROGRESS Center at the American Institutes for Research.
Harlacher, J., Potter, J., & Collins, A. (2024). Untangling data-based decision making: A problem solving model to enhance MTSS. Marzano Resources.
Nitz, J., Brack, F., Hertel, S., Krull, J., Stephan, H., Hennemann, T., & Hanisch, C. (2023). Multi-tiered systems of support with focus on behavioral modification in elementary schools: A systematic review. Heliyon, 9(6), 1-20.